IMPORTANT – this addon is no longer supported!
We are introducing new Dashboard Addon – which allows to view your softswitch data in nice and presentable way.
Currently it is in the beginning of the development so only basic Active Calls and Web Monitoring functionality is present.
We will expand it and add new functionality based on our Client’s feedback.
Only small number of Clients can request to test/use it for 6 months for selfcost price.
Be quick to reserve your copy NOW!
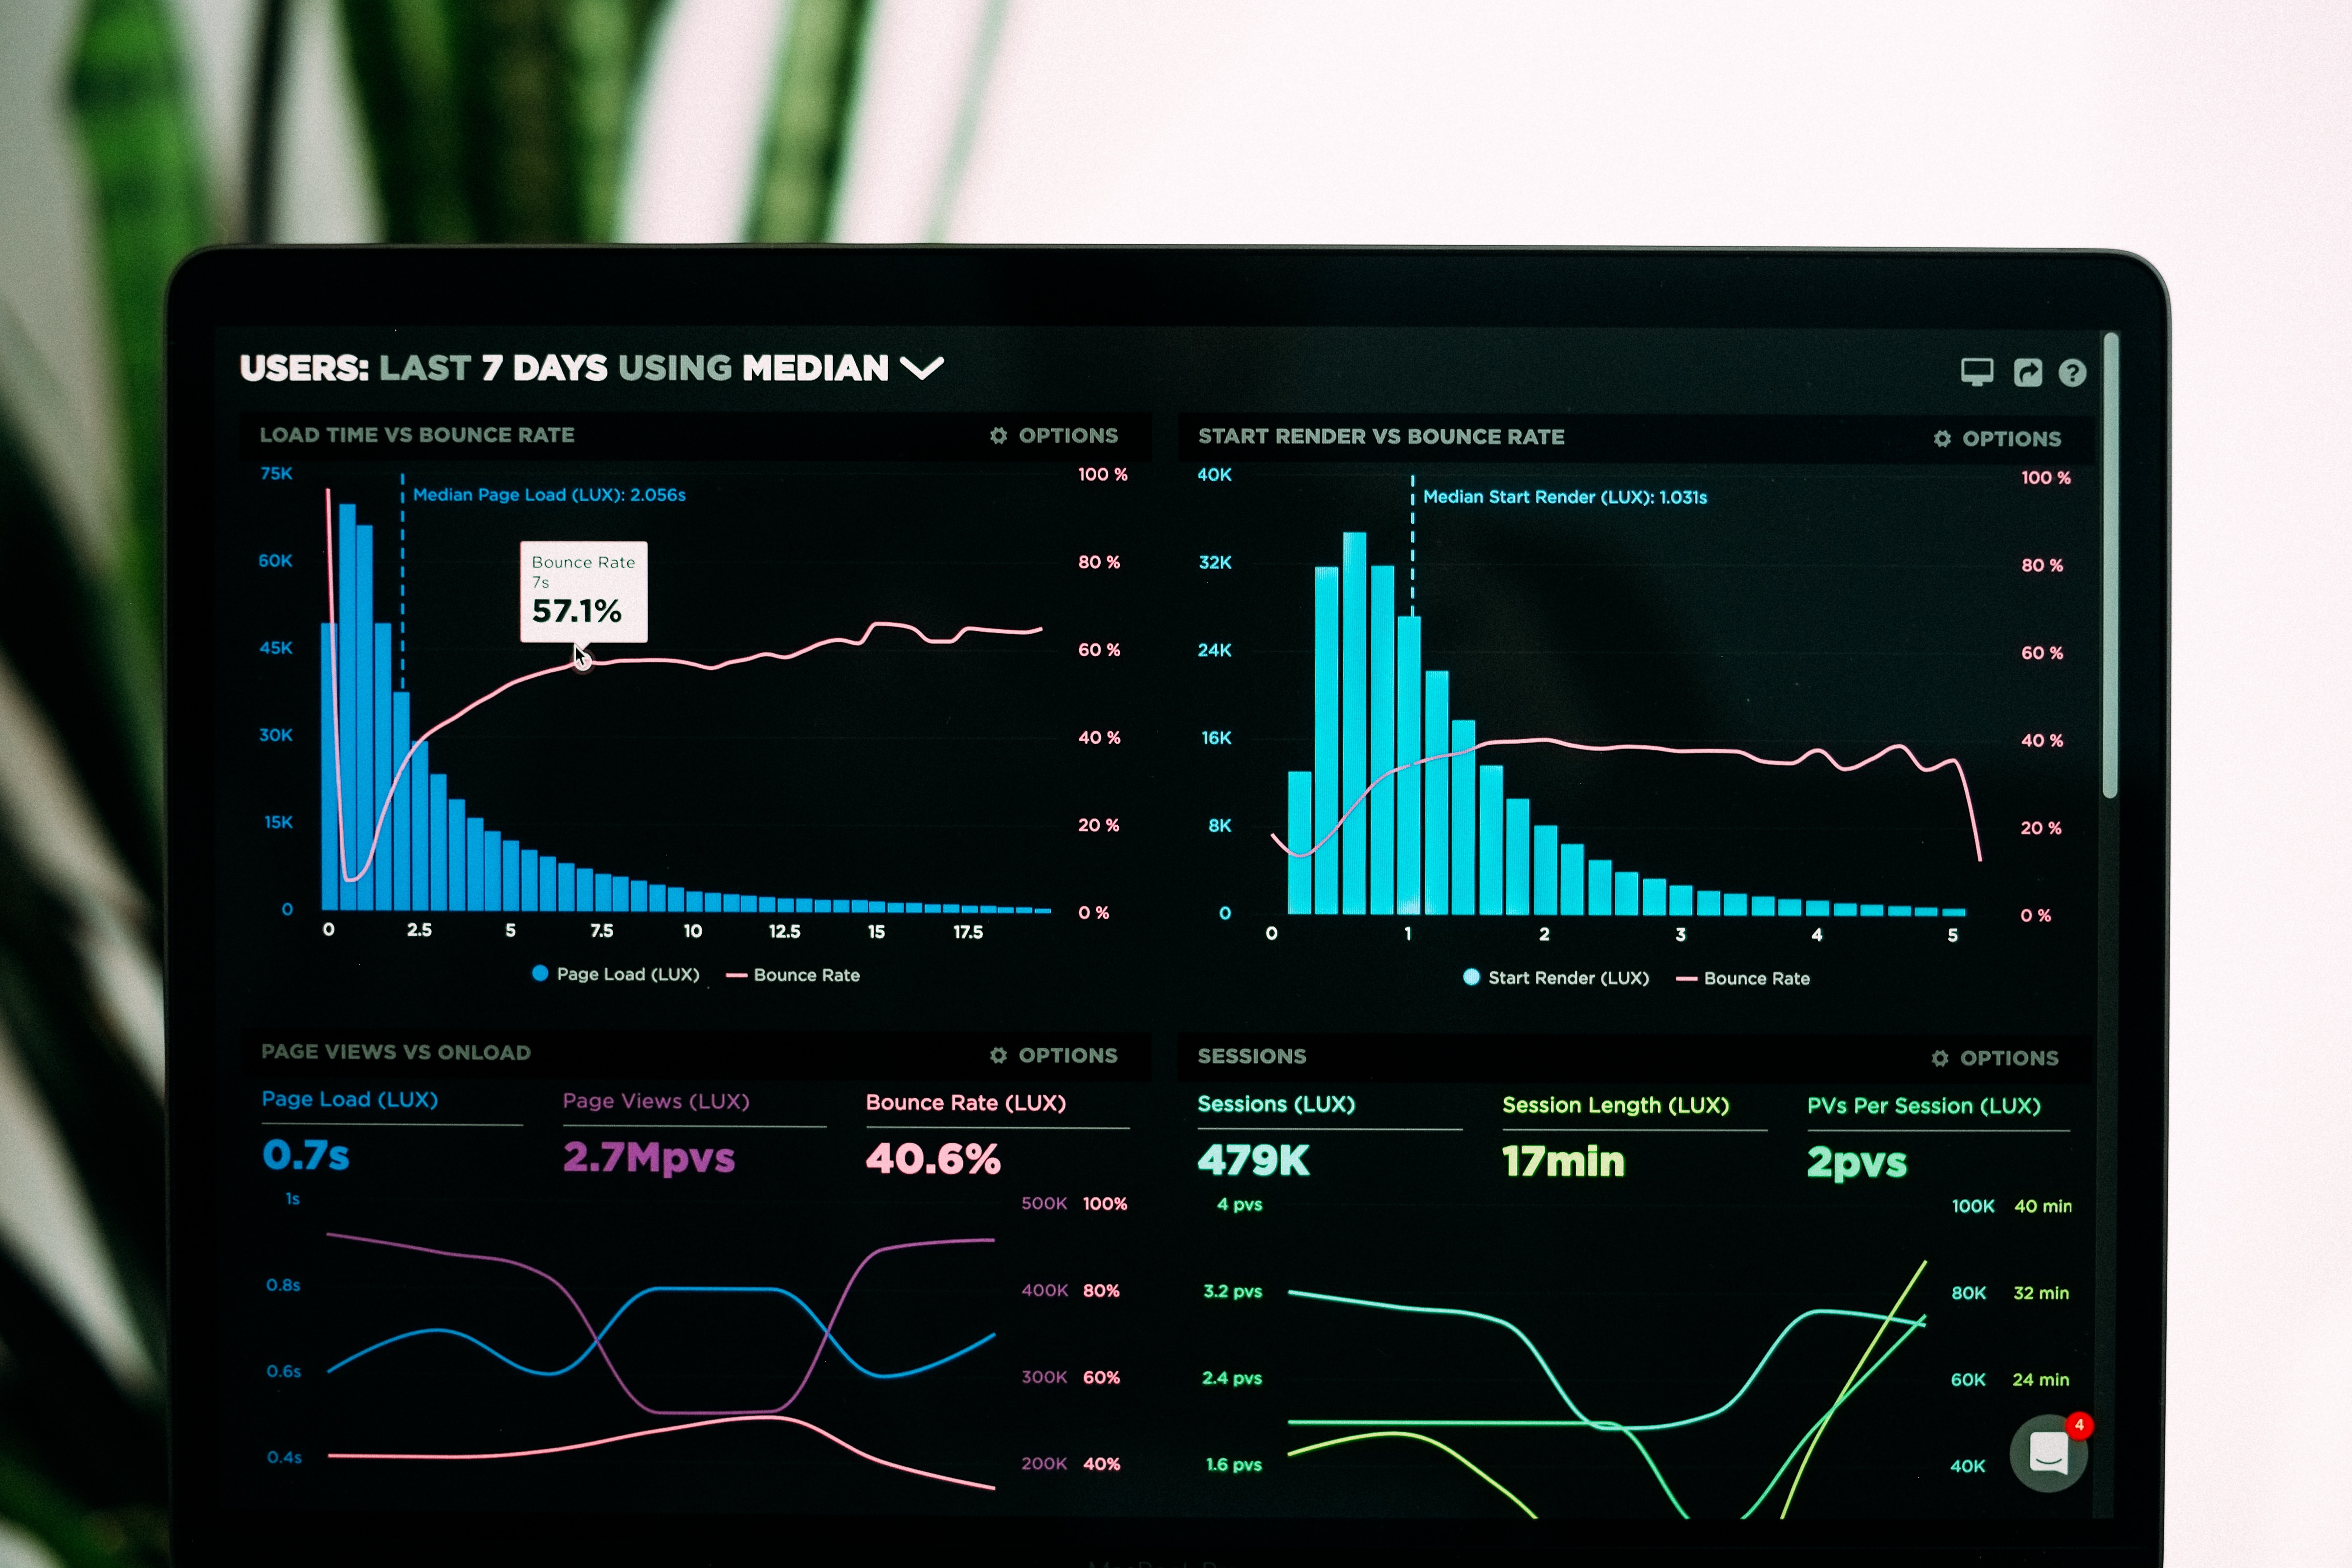
Dashboard Addon is based on Grafana which allows many many various data presentation formats.
Active Calls
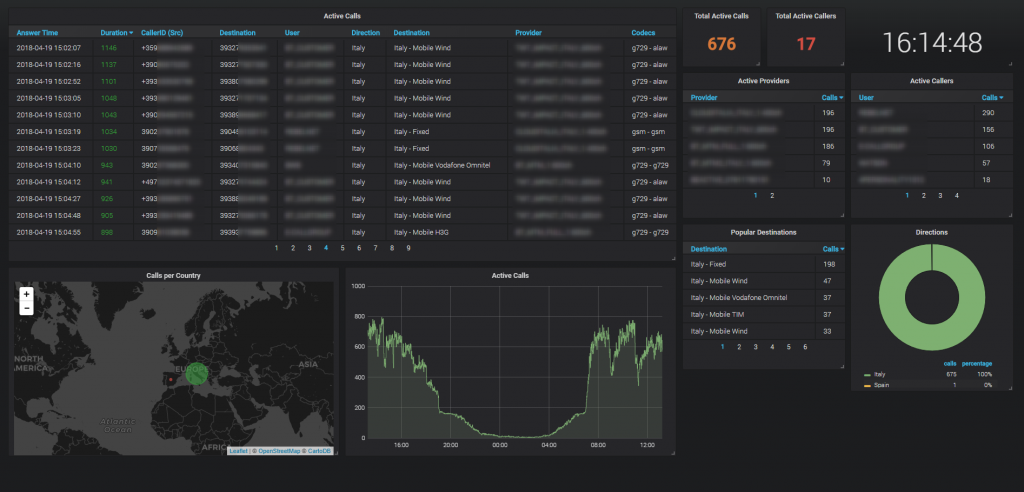
It is possible to add any data from Kolmisoft Softswitch in any format. Tell us what you need – and we will do it!
User interface is intuitive – it is very easy to rearange and reorder stat panels to your liking:
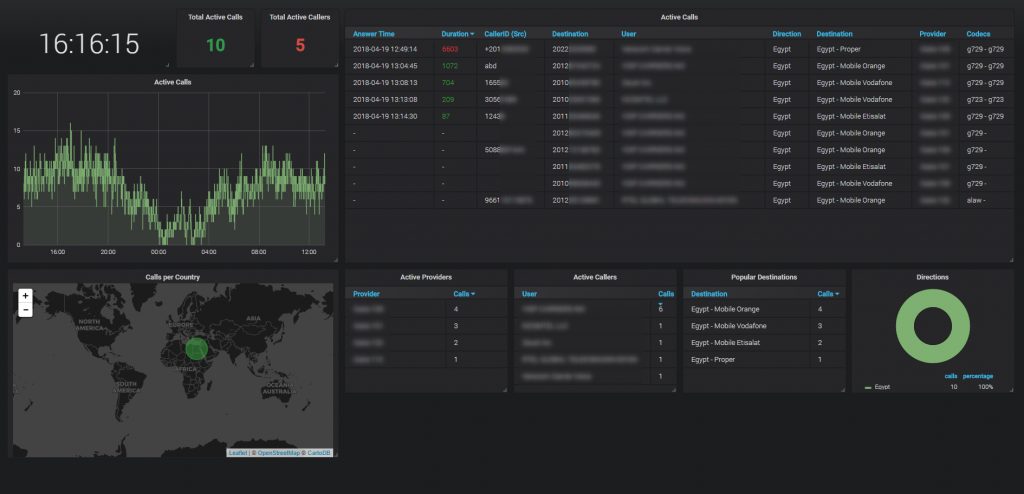
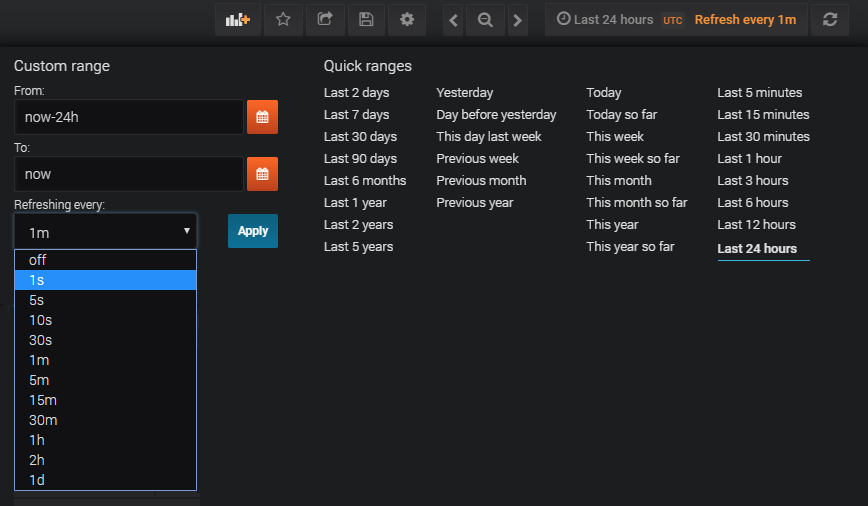
Data refreshes in your selected period. It can vary from 1 second to hours and days.
Kiosk mode allows to show Dashboard without headers/footers on big screen in your office/second monitor or similar. Very convenient for monitoring.
If you are interested, please contact b2bsales@kolmisoft.com for more info.
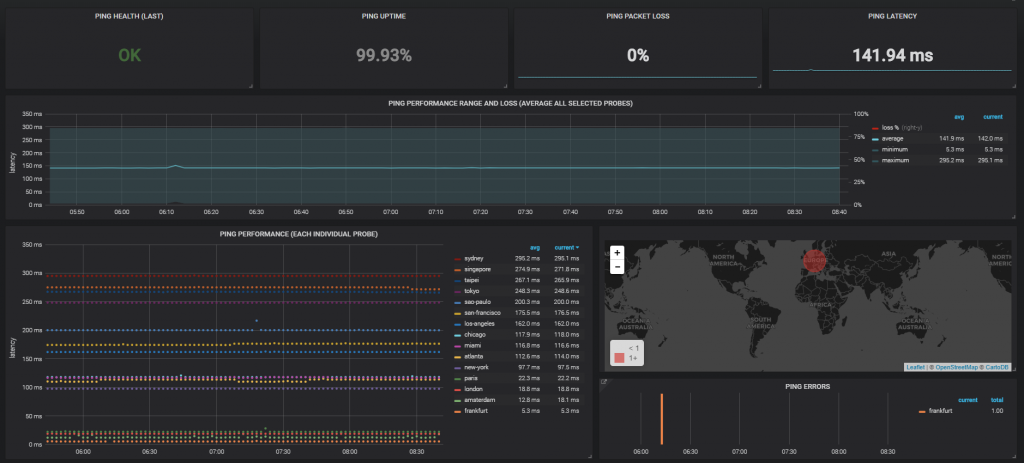
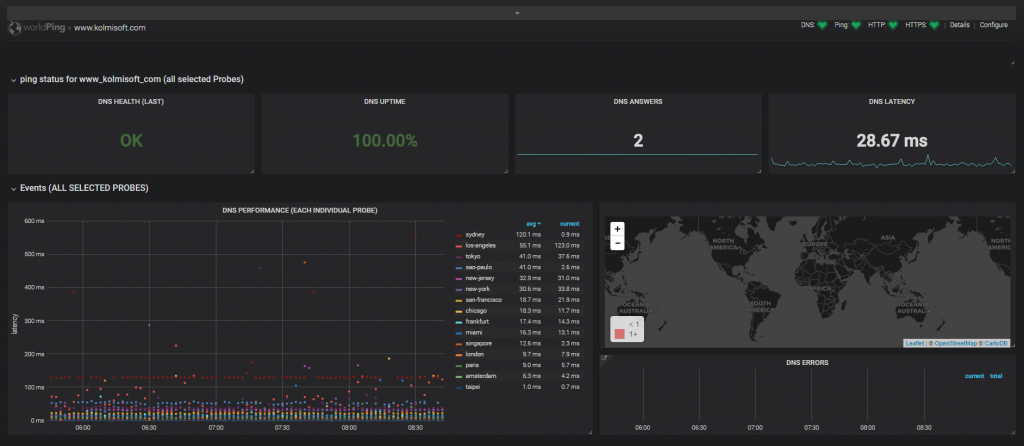
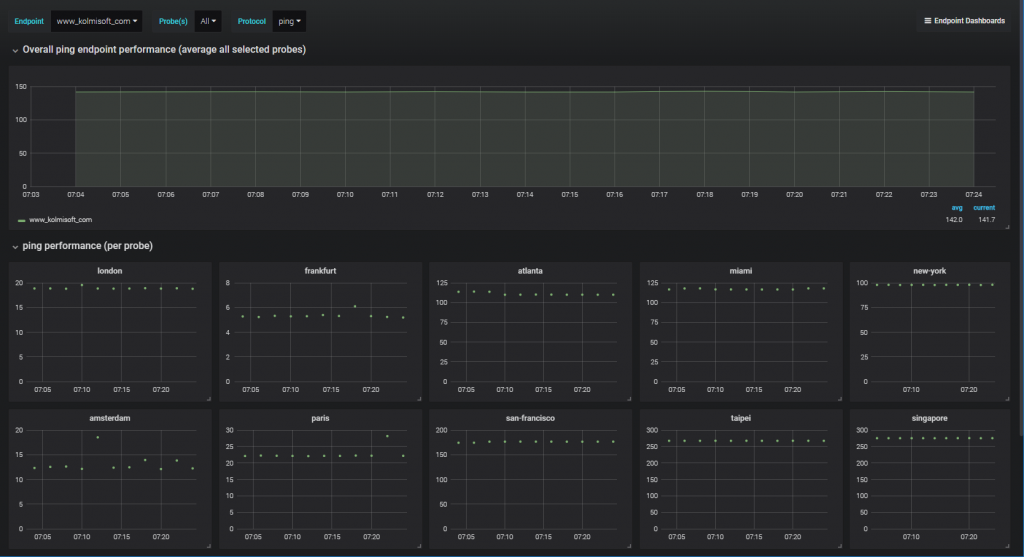
Web Monitoring
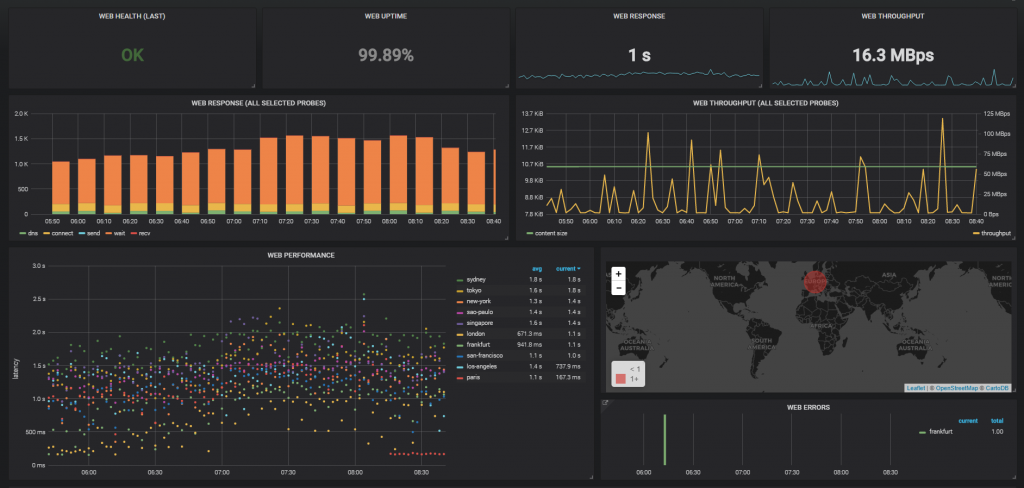
Addon can monitor your web page availability sending requests from around the world:
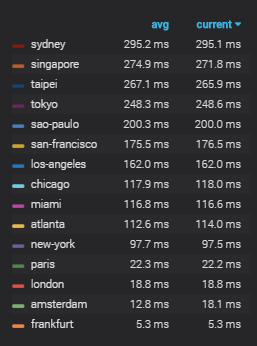
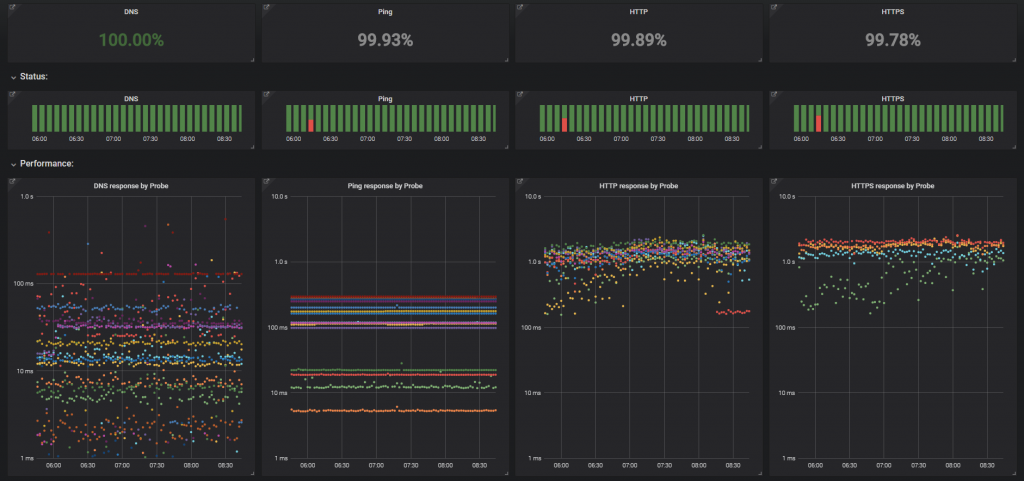
DNS, Ping, HTTP and HTTPS protocols are checked periodically:
![]()
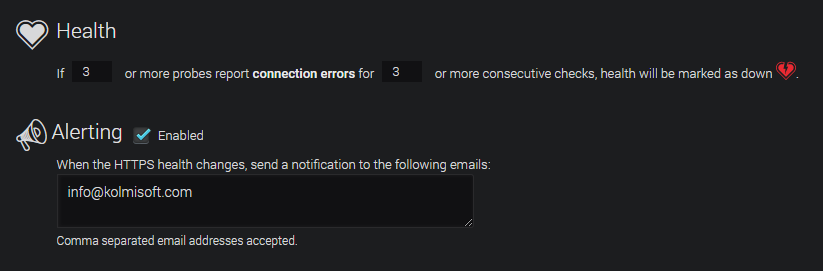
If site is down – alerts are send over email:
Various reports are available:
If you are interested, please contact b2bsales@kolmisoft.com for more info.